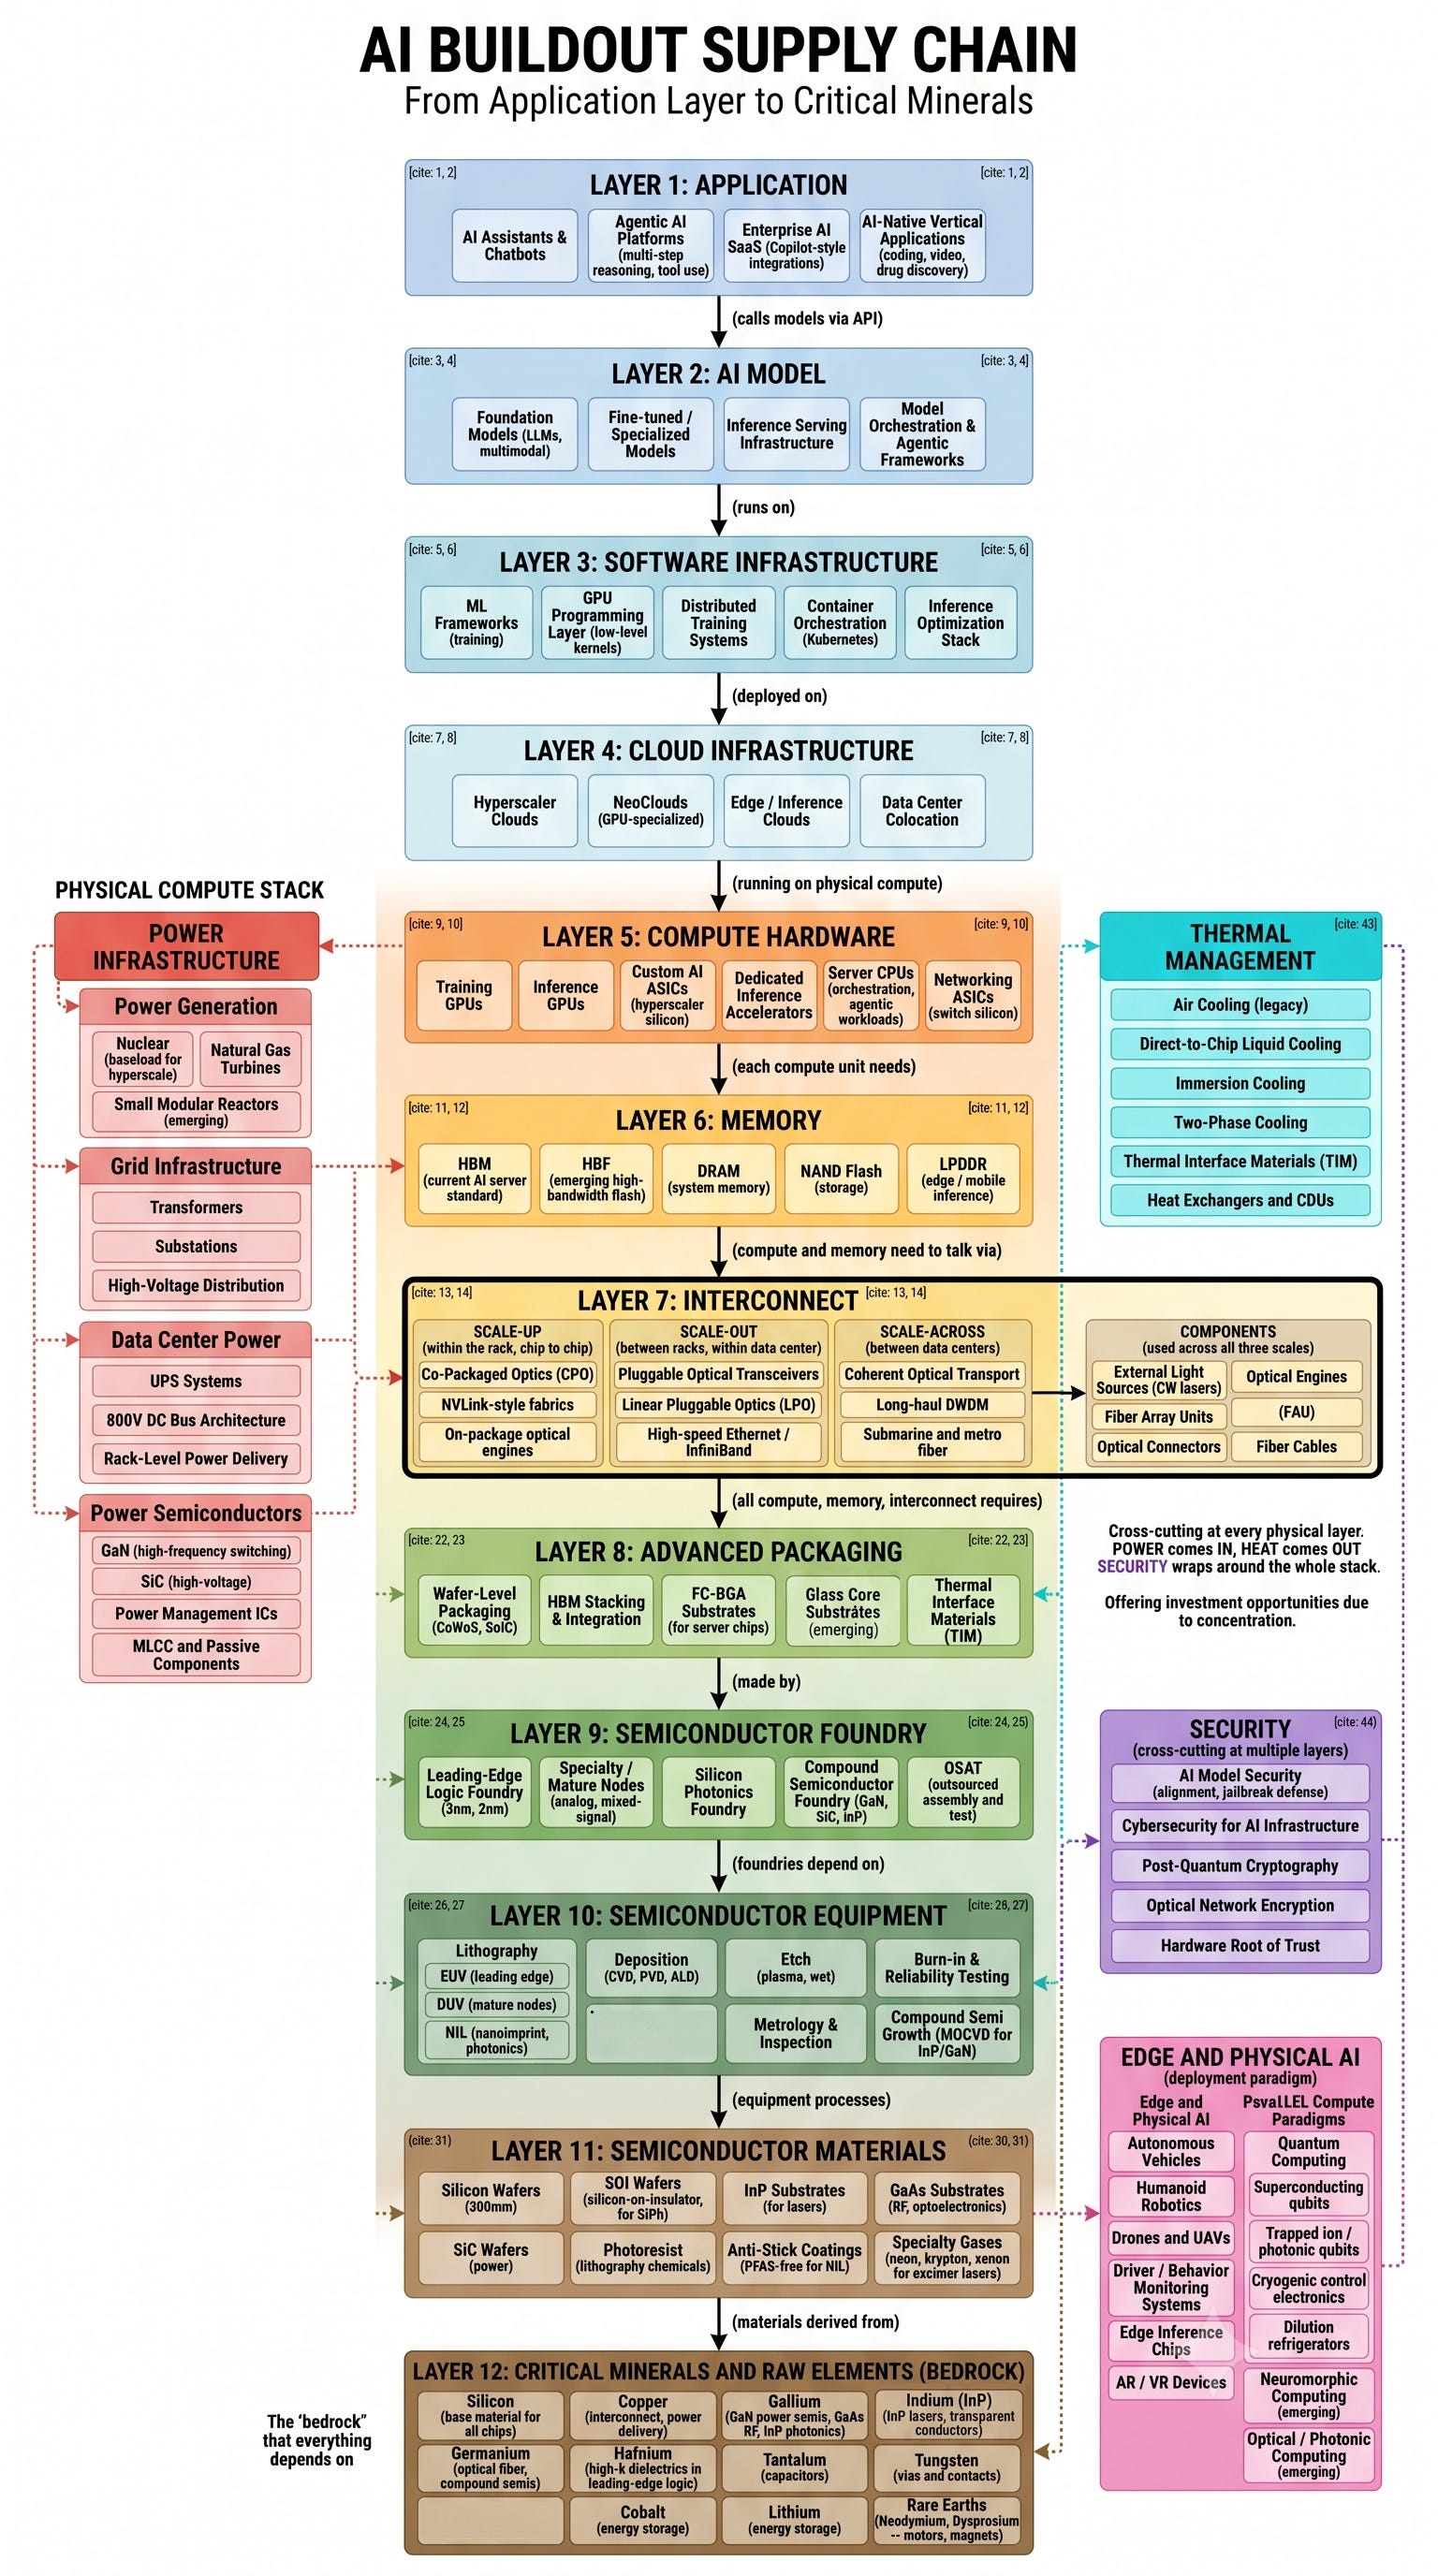
AI bottlenecks are rotating from chips into systems.
A web edition of the AI Buildout Supply Chain room. The near-term evidence stack favors HBM, advanced packaging, and AI networking, while power conversion and photonics remain the most interesting under-verified layers.
The current priority stack.
Priority score is directional: evidence strength plus variant potential plus public exposure minus verification burden. It tells us where to do diligence first, not what to buy.
| Rank | Layer | Evidence | Priority | Public Exposure | Main Verification Need |
|---|---|---|---|---|---|
| 1 | HBM / high-bandwidth memory | High | 11 / P0 | MU, Samsung, SK hynix, NVDA, AMD, TSM | HBM pricing, HBM4 ramps, capex, hyperscaler memory-cost commentary |
| 2 | Advanced packaging / CoWoS | High | 10 / P0 | TSM, AMKR, ASX, INTC, AMAT, LRCX, KLAC, ASML | CoWoS capacity, OSAT utilization, substrate lead times, packaging backlog |
| 3 | AI networking / scale-up fabric | High | 10 / P0 | NVDA, AVGO, MRVL, ANET, CSCO, AMD | Switch ASIC revenue, Ethernet and NVLink adoption, custom ASIC wins |
| 4 | Power availability / grid / rackspace | Medium-high | 9 / P0-P1 | ORCL, CRWV, VRT, ETN, GEV, CEG, VST, DLR, EQIX | Interconnection queues, utility filings, gigawatt contracts, energization delays |
| 5 | Foundry / leading-edge wafers | Medium-high | 8 / P1 | TSM, INTC, Samsung, ASML, AMAT, LRCX, KLAC | AI/HPC allocation, utilization, capex digestion, export controls, yield |
| 6 | Power conversion / 800 VDC / SiC / GaN | Medium | 7 / P1 | ON, WOLF, NVTS, STM, TXN, Infineon, ROHM, MPWR, VRT, ETN | Customer design wins, certifications, AI-specific revenue, uptime evidence |
| 7 | Photonics / optical interconnect | Medium | 7 / P1 | AVGO, MRVL, COHR, LITE, GLW, CIEN, TSM, NVDA | 1.6T and 3.2T ramps, CPO adoption, laser supply, optical-engine wins |
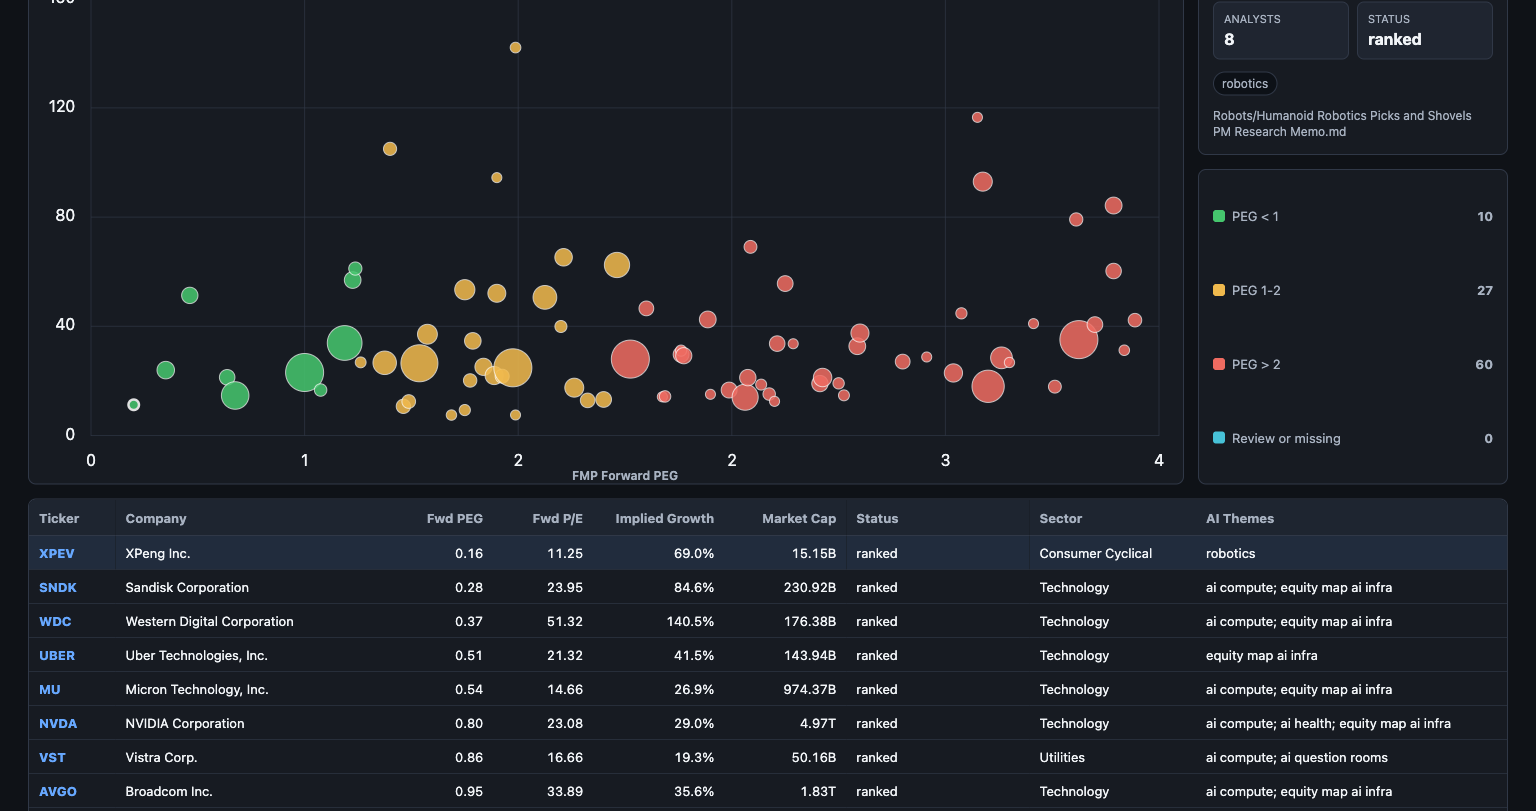
Names that scored highest in the AI buildout map.
This table is a triage layer from the top-50 regional watchlist. It blends layer exposure, valuation, growth, quality, market-cap bucket, and regional representation.
| Rank | Ticker | Company | Layer Group | Score | Market Cap | PEG |
|---|---|---|---|---|---|---|
| 1 | NVDA | NVIDIA Corporation | Interconnect | 95 | 5.04T | 0.80 |
| 2 | 000660.KS | SK hynix Inc. | Memory | 92 | 1.03T | 0.57 |
| 3 | WDC | Western Digital Corporation | Memory | 92 | 178.4B | 0.37 |
| 4 | 005930.KS | Samsung Electronics Co., Ltd. | Memory | 89 | 1.41T | 0.84 |
| 5 | MU | Micron Technology, Inc. | Memory | 84 | 1.06T | 0.59 |
| 6 | STX | Seagate Technology Holdings plc | Memory | 84 | 189.7B | 0.97 |
| 7 | COHR | Coherent, Inc. | Interconnect | 84 | 56.4B | 2.33 |
| 8 | TSM | Taiwan Semiconductor Manufacturing Company Limited | Foundry | 82 | 2.22T | 1.19 |
| 9 | AVGO | Broadcom Inc. | Interconnect | 81 | 1.86T | 0.93 |
| 10 | 6857.T | Advantest Corporation | Equipment | 81 | 119.1B | 2.09 |
| 11 | MRVL | Marvell Technology, Inc. | Interconnect | 79 | 233.5B | 1.79 |
| 12 | ATRL.TO | AtkinsRealis Group Inc. | Power | 79 | 9.6B | 0.24 |
The trap is treating all AI power exposure as one trade.
The vault separates power availability, facility equipment, rack power, power semiconductors, cooling, utilities, and generation. They share a demand driver, but their timing, margin pools, regulation, and disconfirming signals are different.
Next source sprint: build raw-source packets for HBM pricing, CoWoS capacity, networking revenue and backlog, power availability by geography, and 800 VDC / wide-bandgap qualification evidence.